VS
GTX 1050 Ti
+
CORE I3 8100
vs
RX 570
+
CORE I3 8100
GTX 1050 Ti + CORE I3 8100
 81.73
81.73
vs
RX 570 + CORE I3 8100
 233.72
Desempenho médio global
| 1% LOW | Média de FPS | Fluidez | ||
|---|---|---|---|---|
| 1920x1080 |
34.39 fps
38.77 fps
|
44.34 fps
56.55 fps
|
90.58%
87.19%
|
|
| 2560x1440 |
-
29.20 fps
|
-
40.00 fps
|
0.00%
88.67%
|
|
| 3840x2160 |
-
-
|
-
-
|
0%
0.00%
|
|
Temperatura média
| 65 °C | em Jogo | 65 0 °C |
| 61 °C | no Furmark | 61 0 °C |
Custo por frame
U$
6.54
1920x1080
U$
0
2560x1440
U$
--
3840x2160
Custo por frame
U$
5.11
1920x1080
U$
7.22
2560x1440
U$
--
3840x2160
Desempenho médio global
| 1% LOW | Média de FPS | Fluidez | ||
|---|---|---|---|---|
| 1920x1080 |
34.39 fps
38.77 fps
|
44.34 fps
56.55 fps
|
90.58%
87.19%
|
|
| 2560x1440 |
-
29.20 fps
|
-
40.00 fps
|
0.00%
88.67%
|
|
| 3840x2160 |
-
-
|
-
-
|
0%
0.00%
|
|
Temperatura média
| 65 °C | em Jogo | 65 0 °C |
| 61 °C | no Furmark | 61 0 °C |
Custo por frame
U$
6.54
1920x1080
U$
0
2560x1440
U$
--
3840x2160
Desempenho médio global
| 1% LOW | Média de FPS | Fluidez | ||
|---|---|---|---|---|
| 1920x1080 |
38.77 fps
38.77 fps
|
56.55 fps
56.55 fps
|
87.19%
87.19%
|
|
| 2560x1440 |
29.20 fps
29.20 fps
|
40.00 fps
40.00 fps
|
88.67%
88.67%
|
|
| 3840x2160 |
-
-
|
-
-
|
0.00%
0.00%
|
|
Temperatura média
| 0 °C | em Jogo | 0 0 °C |
| 0 °C | no Furmark | 0 0 °C |
Custo por frame
U$
5.11
1920x1080
U$
7.22
2560x1440
U$
--
3840x2160
Especificações técnicas
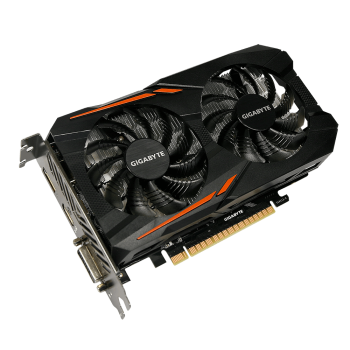
| Gigabyte | Brand | PowerColor |
| GV-N105TOC-4GD | Model | AXRX 570 4GBD5-3DHD/OC |
| GP107 | GPU | Ellesmere |
| 14 nm | Technology | 14 nm |
| 3300 M | Transistors | 5700M |
| 112.1 GB/s | Bandwidth | 224.0 GB/s |
| 1367 MHz | GPU Clock | 1250 MHz |
| 1752 MHz | Memory Clock | 1750 MHz |
| 1481 MHz | Boost Clock | None |
| 768 | Shaders | 2048 Unified |
| GDDR5 (Samsung) | Memory Type | GDDR5 (Hynix) |
| 128 BIt | Bus Width | 256 Bit |
| Oct 25, 2016 | Release Date | Apr 18, 2017 |
| 300w | Minimum Power Supply | 450 W |
| 350w | Recommended Power Supply | 500 W |
| 388.71 (7 Gen Intel with 398.36) | Driver | 18.8.1 |
| http://bit.ly/PapaHardwareGames Link | Benchmark Configs | http://bit.ly/PapaHardwareGames Link |
| 3x HDMI 1x DisplayPort 1x DVI-D | I/O | 1x HDMI, 1x DVI, 3x DisplayPort |
| http://www.gigabyte.com/products/product-page.aspx?pid=6052#kf Link | Website | https://www.powercolor.com/product?id=1493878067 Link |
| Dec 21, 2017 | Test Date | Aug 16, 2018 |
| 4096 MB | Memory Size | 4096 MB |
Configuração usada para teste
| Motherboard | Z370 SLI / Z270 SLI |
| RAM | (16GB) - MEMÓRIA (2x8GB) DDR4 2666MHz |
| HD/SSD | WESTERN DIGITAL BLUE 1TB |
| OS | WINDOWS 10 |
| Power Supply | 1200W |
| Case | OPEN AIR TEST BENCH |
Resultados do teste
Selecione uma resolução
-
 Battlefield 1
Ultra Quality73.44 Fluidez 76.011% LowAverage
Battlefield 1
Ultra Quality73.44 Fluidez 76.011% LowAverage -
 GTA 5
Custom93.63 Fluidez 94.011% LowAverage
GTA 5
Custom93.63 Fluidez 94.011% LowAverage -
 Far Cry 5
Ultra91.96 Fluidez 95.691% LowAverage
Far Cry 5
Ultra91.96 Fluidez 95.691% LowAverage -
 Assassins Creed Origins
High Quality88.17 Fluidez 93.911% LowAverage
Assassins Creed Origins
High Quality88.17 Fluidez 93.911% LowAverage -
 The Witcher 3
Ultra (no Hairworks)89.90 Fluidez 90.301% LowAverage
The Witcher 3
Ultra (no Hairworks)89.90 Fluidez 90.301% LowAverage -
 Middle Earth: Shadow Of War
Very High Quality96.18 Fluidez 98.221% LowAverage
Middle Earth: Shadow Of War
Very High Quality96.18 Fluidez 98.221% LowAverage -
 Final Fantasy XV
Highest77.05 Fluidez 85.901% LowAverage
Final Fantasy XV
Highest77.05 Fluidez 85.901% LowAverage


-
Battlefield 1
Ultra Quality76.27 Fluidez 0.001% LowAverage
-
GTA 5
Custom94.39 Fluidez 0.001% LowAverage
-
Far Cry 5
Ultra93.95 Fluidez 0.001% LowAverage
-
Assassins Creed Origins
High Quality90.65 Fluidez 0.001% LowAverage
-
The Witcher 3
Ultra (no Hairworks)93.32 Fluidez 0.001% LowAverage
-
Middle Earth: Shadow Of War
Very High Quality96.54 Fluidez 0.001% LowAverage
-
Final Fantasy XV
Highest75.60 Fluidez 0.001% LowAverage
-
Battlefield 1
Ultra Quality0.00 Fluidez1% LowAverage
-
GTA 5
Custom0.00 Fluidez1% LowAverage
-
Far Cry 5
Ultra0.00 Fluidez1% LowAverage
-
Assassins Creed Origins
High Quality0.00 Fluidez1% LowAverage
-
The Witcher 3
Ultra (no Hairworks)0.00 Fluidez1% LowAverage
-
Middle Earth: Shadow Of War
Very High Quality0.00 Fluidez1% LowAverage
-
Final Fantasy XV
Highest0.00 Fluidez1% LowAverage