review
RTX 2060 SUPER FE + CORE I3 8100
VS
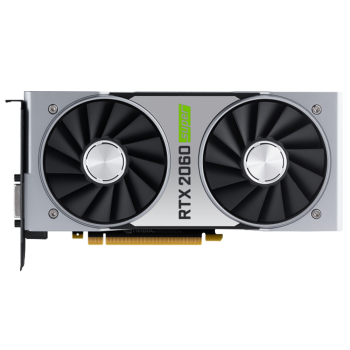
RTX 2060 SUPER FE
+
CORE I3 8100
RTX 2060 SUPER FE + CORE I3 8100

 626.15
Global Average Performance
| 1% LOW | Average FPS | Smoothness | ||
|---|---|---|---|---|
| 1920x1080 | 59.06 fps | 87.71 fps | 88.91% | |
| 2560x1440 | 49.72 fps | 72.82 fps | 88.16% | |
| 3840x2160 | 33.34 fps | 44.76 fps | 90.56% |
Average Temperature
| In Game | 0 0 °C |
| In Furmark | 0 0 °C |
Cost per frame
U$
5.92
1920x1080
U$
7.13
2560x1440
U$
11.59
3840x2160
Configuration Used for Testing
| Motherboard | Z370 SLI / Z270 SLI |
| RAM | (16GB) - MEMÓRIA (2x8GB) DDR4 2666MHz |
| HD/SSD | WESTERN DIGITAL BLUE 1TB |
| OS | WINDOWS 10 |
| Power Supply | 1200W |
| Case | OPEN AIR TEST BENCH |
Test Results
Select a resolution
-
 Middle Earth: Shadow Of War
Very HighSmoothness 96.511% LowAverage
Middle Earth: Shadow Of War
Very HighSmoothness 96.511% LowAverage -
 The Witcher 3
Ultra (No Hairworks)Smoothness 81.931% LowAverage
The Witcher 3
Ultra (No Hairworks)Smoothness 81.931% LowAverage -
 Monster Hunter World
HighSmoothness 94.601% LowAverage
Monster Hunter World
HighSmoothness 94.601% LowAverage -
 GTA 5
CustomSmoothness 92.311% LowAverage
GTA 5
CustomSmoothness 92.311% LowAverage -
 Shadow Of The Tomb Raider
High (DX12)Smoothness 77.781% LowAverage
Shadow Of The Tomb Raider
High (DX12)Smoothness 77.781% LowAverage -
 Assassins Creed Odyssey
HighSmoothness 90.351% LowAverage
Assassins Creed Odyssey
HighSmoothness 90.351% LowAverage


-
Middle Earth: Shadow Of War
Very HighSmoothness 96.391% LowAverage
-
The Witcher 3
Ultra (No Hairworks)Smoothness 80.971% LowAverage
-
Monster Hunter World
HighSmoothness 92.181% LowAverage
-
GTA 5
CustomSmoothness 90.661% LowAverage
-
Shadow Of The Tomb Raider
High (DX12)Smoothness 83.721% LowAverage
-
Assassins Creed Odyssey
HighSmoothness 85.051% LowAverage
-
Middle Earth: Shadow Of War
Very HighSmoothness 98.281% LowAverage
-
The Witcher 3
Ultra (No Hairworks)Smoothness 88.811% LowAverage
-
Monster Hunter World
HighSmoothness 95.921% LowAverage
-
GTA 5
CustomSmoothness 92.301% LowAverage
-
Shadow Of The Tomb Raider
High (DX12)Smoothness 92.221% LowAverage
-
Assassins Creed Odyssey
HighSmoothness 75.821% LowAverage